


For most business owners, a significant source of anxiety is not knowing how their business is performing on a day-to-day basis. I talk with several business owners every month who don’t know their revenue, conversion rates or profitability. As a result, they spend most nights tossing and turning.
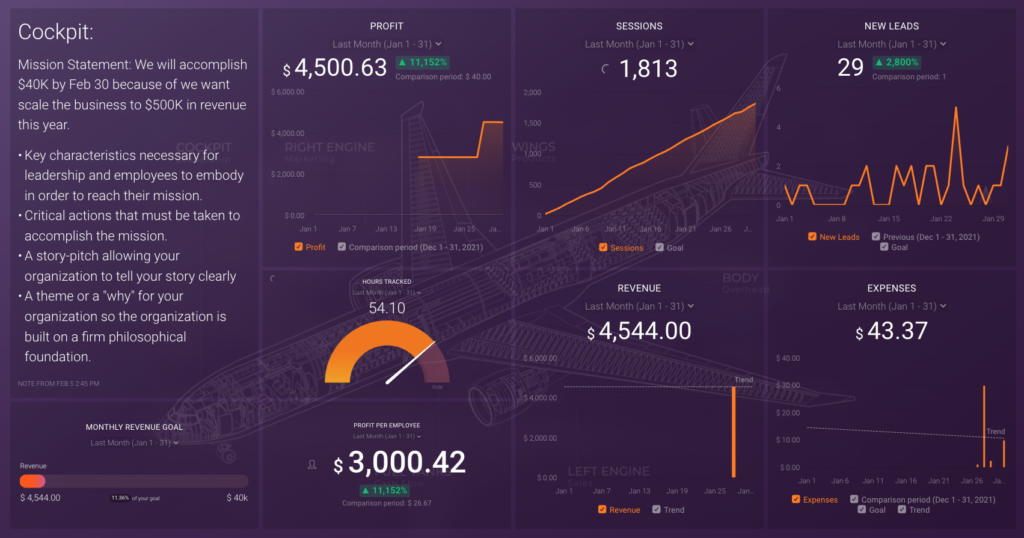
At Business Made Simple (BMS), one aspect of our business coaching system is the development of a business made simple digital dashboard. A digital dashboard gives you the instrumentation that tracks your most important business metrics: revenue, profit, profit per employee, and leads.

As you already know, BMS explains that you should think of your business like an airplane. This analogy breaks down your business into seven understandable parts:
- Cockpit = Leadership
- Wings = Products
- Right Engine = Marketing
- Left Engine = Sales
- Fuselage = Overhead
- Fuel = Cashflow
When all parts of your airplane are working correctly, your business will fly faster and farther.
The digital dashboard serves as the instrumentation for your airplane (aka, business). A digital dashboard will give you a clear picture of whether your business is going up or down.
A digital dashboard gives you the insights and trends that give you the information needed to make critical decisions to avoid crashing. For example, you can see—in real-time, if leads are starting to dip, which is an indication that Google may have changed its algorithm, a competitor entered the space, or your latest Facebook Ad campaign needs attention. Declining profit-per-team-member may signify problems in your process or customer service.
In this article, I’ll give you three easy steps and the metrics you need to set up a basic business-made simple digital dashboard.
1. Four Metrics You Must Know to Run a Business
There are four digital dashboard metrics you need that will give you an understanding of how your business is doing, they are:
- Revenue – Revenue tells you how much thrust and power the business produces.
- Profit – Profit tells you the pitch and the altitude of the business. Are you going up or going down?
- Profit per team member (PTM) – PTM is the airplane’s fuel efficiency. It tells you if your business is optimized and creates value for your customers. (Use the equation: Profit divided by team member to find your PTM)
- Leads – Gives you an indication of how much business you will be doing in the future. Leads are one of the best ways to forecast future business. Leads also represent how much fuel you have outside of the airplane.
2. Choose the Right Data Sources
There are over 8,000 marketing technology companies. From HubSpot to QuickBooks, you can find software that tracks and measures just about anything. Here are some example programs that will pull in the data sources you need for your dashboard:
Revenue, Profit, and PTM
Almost every business uses bookkeeping software. To find your revenue, profit, and profit per team member metrics, you’ll likely want to use QuickBooks, Xero or FreshBooks as your data source. These metrics can be imported into your dashboard and set up to display these essential financial metrics.
Leads
For leads, consider HubSpot to track leads across all your lead generators, i.e., contact forms, ebooks, video series, checklists, or other value-added resources.
Tracking visitor-to-lead conversion rates and lead-to-customer conversion rates can give you peace of mind because you know what the next month or quarter will look like. In addition, this information provides you data on when to make new hires, purchase new equipment, or make investments.
3. Display Your Goal
Another critical area of your dashboard should be your mission statement, key characteristics, critical actions, and why this goal matters.
Use this formula: We will accomplish X by X because of X.
An example looks like this: We will accomplish $40K in revenue by Q2 because we want to scale our business to compete against bigger competitors.
- Key characteristics: What key characteristics does your team need to accomplish your mission?
- Critical actions: What needs to happen daily? These can also be called your outcomes.
- A Story pitch: Tell your story clearly.
- Why: Why are you doing this? Why does this goal matter?
So many business owners overlook or don’t see the importance of having these goals front and center. By frequently adding this into your mind, you know where you are going and how to get there. Combine this with a daily planner, and you’re direction and cadence day in and day out will help you stay focused.
In conclusion, developing a digital dashboard for your business creates the instrumentation and visuals you need to fly your business straight, fast, and far. Chose the right metrics to track, integrate the suitable data sources and keep your goals and direction front and center for maximum focus and traction.
Interested in setting up your own business made simple digital dashboard? Click the button below!
Set Up Your Digital Dashboard!